![]() pdf of Using Sketches to Tell the Energy Story
pdf of Using Sketches to Tell the Energy Story
In this unit, students are often asked to use words and sketches to "tell the energy story" of a system. Frequently, they are asked to use sketches to show how they moved their energy cubes to tell the energy story. So, what are the advantages and challenges of sketching the energy cubes?
There are many advantages to using sketches. Sketches are tools that give students a "second look" at their thoughts about the energy story. Creating a sketch of their ideas about the flow of energy allows students to "step back" and take another look at their own thinking. They can ask, "Does this still make sense to me? Does it represent what I really think happened? Am I accounting for everything?" Sketches are not finished products. They are often revised; a whiteboard and dry erase markers are perfect materials for this purpose. Sketches can also be used to help share a student’s (or group's) thinking with others, but they are not intended to be stand-alone. They are not finished products and typically need to be supplemented by an explanation.
Representing a dynamic process such as the flow of energy with a sketch has limitations. The flow of energy through a system is a dynamic process that occurs across time and space, changing from moment to moment. Sliding and flipping the energy cubes through a set of component circles is likewise a dynamic process and an effective way to represent the flow of energy through a system. A sketch, on the other hand, is static. What moment or moments in the process does the sketch represent? What is being left out of such a sketch? In response to this challenge, the Focus on Energy unit suggests that students create a short series of sketches that capture the energy story at key points in time. A common recommendation is to sketch the location of the energy cubes at two or three moments of time to show before and after an event, or before, during, and after an event. Below are a few examples of using sketches to portray the flow of energy through a system.
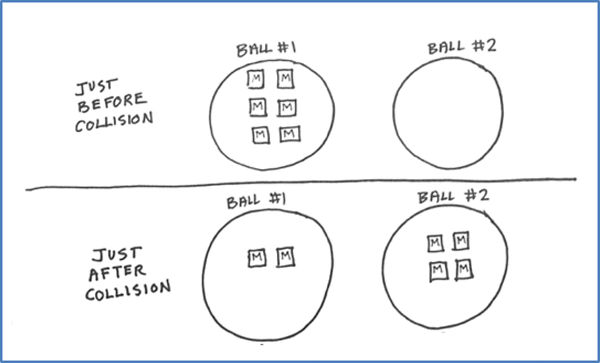
Example #1: This sketch shows the motion energy of two balls immediately before and immediately after Ball #1 collides with stationary Ball #2.
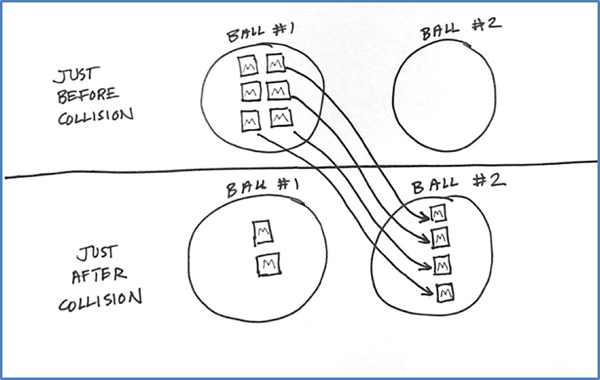
Example #2: This sketch shows the same event of balls colliding but highlights the fact that most of the motion energy of Ball #1 was transferred to Ball #2 immediately after the collision.
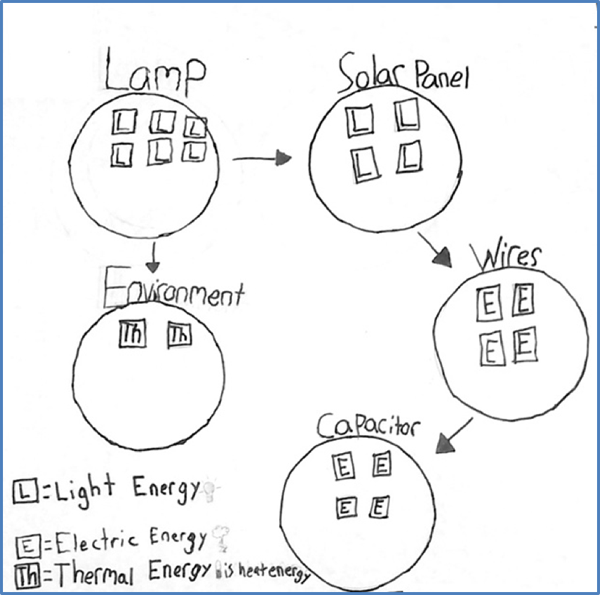
Example #3: This sketch shows the flow of energy through a more complex system. The light from a lamp falls on a solar cell, which converts light energy into electrical energy that charges a capacitor. The sketch uses arrows and cubes differently, to simultaneously show the passage of time and the change of location and form as energy flows through the system.
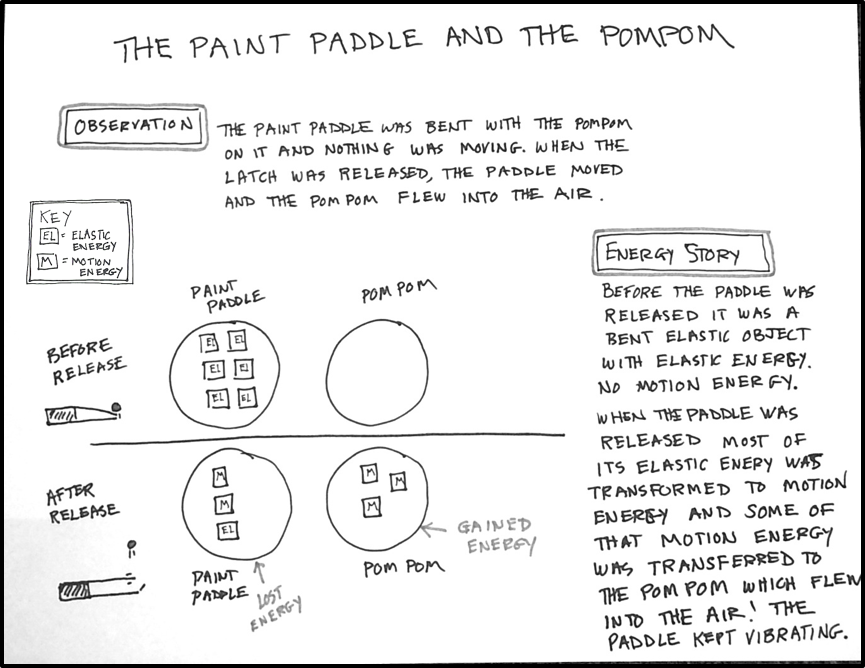
Example #4: This example includes not only the sketch of the components and cubes at two different points in time but also provides a title, a key, the observations of an event, and the energy story.
In all cases, the sketches attempt to show the way in which students moved their energy cubes through the components of a system to tell the energy story. And, in all cases, the sketches are tools that give students a "second look" at their thoughts about the energy story.